Where do I lose reception and why is it happening? The maps in the upgraded version of our app have the answers.
The upgraded version of our app – SignalTrackerPro – has an auto-test feature and shows your results in maps and graphs, but what can I use it for?
Most of us commute to work, or make another regular journey where mobile connectivity is important for calls; music or videos; answering emails; or social media.
SignalTrackerPro shows a map of the mobile reception on your journey.
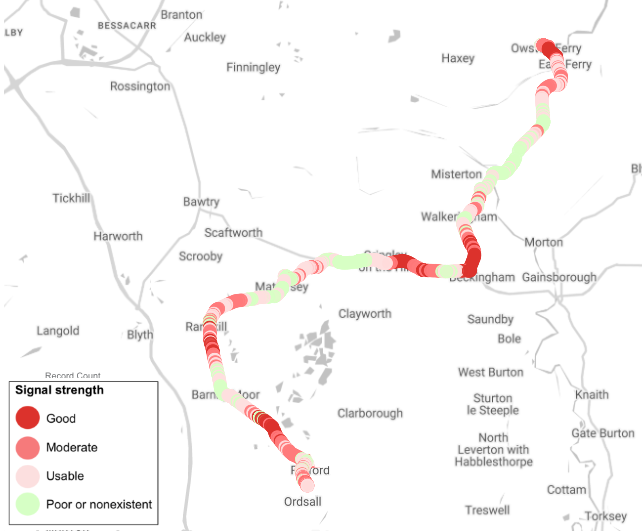
Driving south to Retford, Nottinghamshire, UK.
The better the reception, the deeper shade of red. Green indicates a poor signal or none at all. The green sections on the map mean internet access is unlikely and calls may drop.
We made the map using two SignalTrackerPro features. During the drive we ran the Background Auto Tests, which measure signal strength every 10 seconds and are shown on the Signal Strength Map above. They also run a speed test every minute and the results are shown in the Speed Tests and Technology Map below.
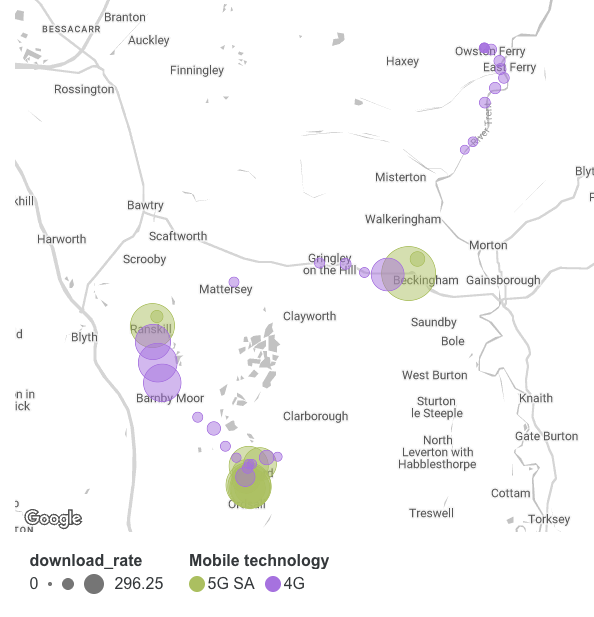
Speed tests from the same journey
What do these maps tell us? The coverage gaps – shown in green in the first map – lead to slow download speeds or no internet connectivity at all. It typically improves in villages or towns, but there are several parts of the journey with pretty poor service.
Would a different operator be any better? SignalTrackerPro can help you there as well – see the Operator Performance tab
Get SignalTrackerPro by downloading the standard app then linking it to your Google account.
